
The fascination with Donald Trump’s dramatic rise in the presidential polls is portrayed by some in the media as an unfathomable, unprecedented ride to the top.
Not even close.
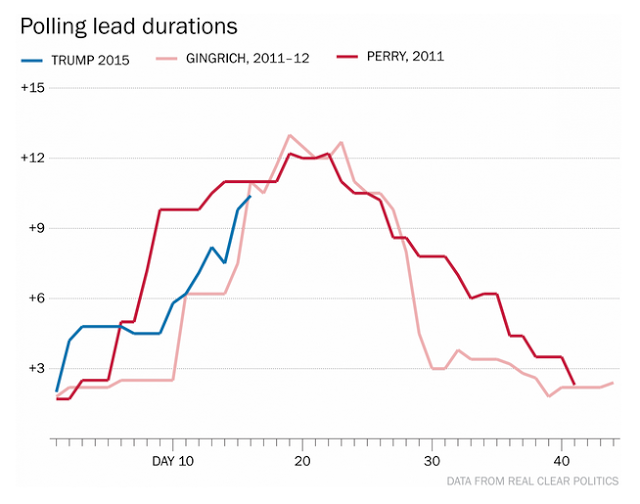
The Washington Post’s blog “The Fix” demonstrates today that, not only is there precedent for this, all anyone needs to do is go back four years ago to the last presidential cycle on the Republican side of the aisle.
The Fix created a graph that charts the rise and fall of Rick Perry and Newt Gingrich in 2011and the upward lines chart very closely to the Trump numbers over the past few weeks. If Trump manages a spectacular fall — as many pundits expect, and many in the GOP hope for — it will mark the third time in the past two cycles that the Republicans have put a candidate on a pedestal, only to watch him take a dramatic tumble.
Here’s The Fix’s Philip Bump cautioning against hyperbole about Trump:
“What’s … obvious is that this surge is still pretty fledgling. The spike happened shortly after his Arizona rally with Sheriff Joe Arpaio, less than a month ago. Granted, three weeks is a long time, but it’s not unprecedented. In (2011), Rick Perry led in the polling average for 41 days, from Aug. 24, 2011, to Oct. 3. Newt Gingrich led even longer.
“If we compare Trump’s lead to the periods that Perry and Gingrich led, we see that this is hardly unusual — by the standards of the new presidential primary usual-ness.”
Recent Posts:
 Trump team favors Kid Rock over solid GOP field for Senate
- Could Trump-induced mess in Washington lead to a new…
- Will Detroit get Amazon’s 50,000 jobs? Analysis…
- Obamacare in a ‘death spiral?’ GOP and Berniecrats…
- Liberal purists cheer GOP moderates, hate Dem moderates
- GOP Rep’s bill calls for elimination of state Senate