
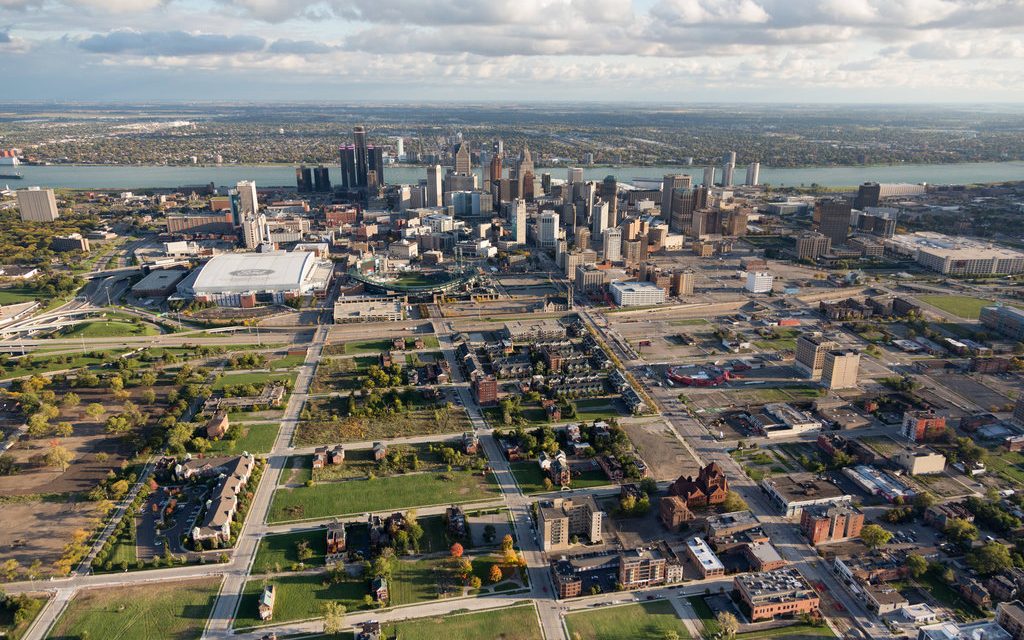
Gov. Gretchen Whitmer may want to add another item to her to-do list if she gets a look at the latest statistics showing that 10 of Michigan’s 11 metropolitan areas suffer from a significant degree of racial segregation.
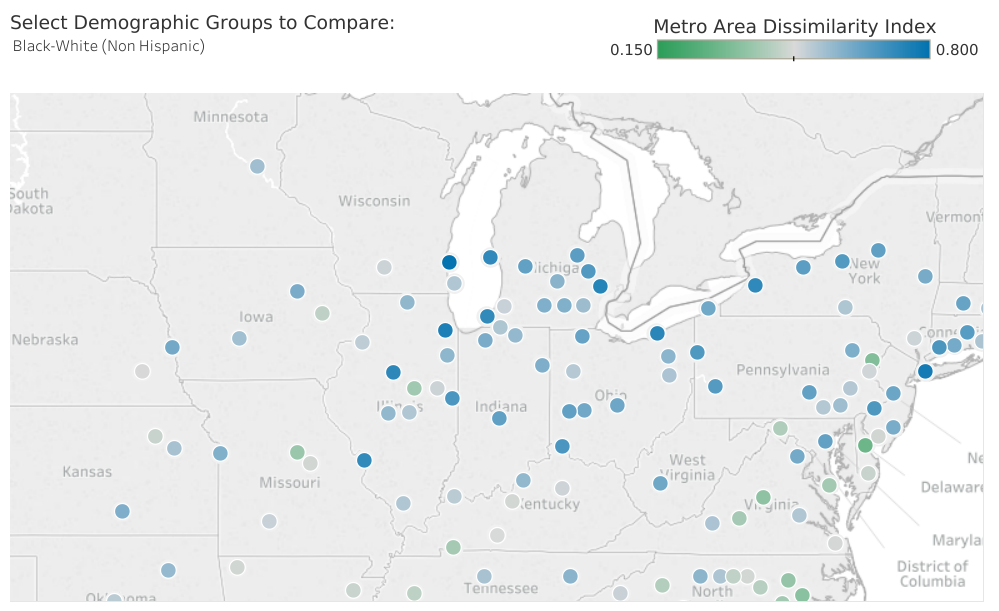
The newest snapshot of segregation across the U.S. was compiled by Governing Magazine (Governing.com) using U.S. Census Bureau data. What they found was that Detroit ranks as the fourth-most segregated metro area, with a divide between black and white residents that ranks behind only Milwaukee, New York and Chicago.
But the study also found that other Michigan cities, such as Grand Rapids and Lansing, also have a high rate of segregation in housing. The Census Bureau information from 2013-17 is able to show white and black populations in metropolitan areas on a neighborhood-by-neighborhood basis.
The numbers were crunched and turned into rankings for hundreds of U.S. cities by using the dissimilarity index, a common measure sociologists use that considers how evenly distributed demographic groups are throughout an urban-suburban area. Each metro area is given a score on a range from 0 (fully integrated) to 1 (fully segregated). The national average is .526.
Here is how Michigan’s major metro areas stack up, along with their score on the dissimilarity index:
Detroit — .737
Muskegon — .719
Niles — .718
Flint — .666
Saginaw — .649
Grand Rapids — .640
Battle Creek — .598
Jackson — .595
Lansing — .584
Ann Arbor — .555
Kalamazoo — .497
Kalamazoo is the state’s only metro area that falls below the national average. In contrast, the Governing report is the latest among several studies in recent years that have ranked Detroit among the nation’s most segregated metropolitan areas.
Surprisingly, some of the most integrated cities in the U.S. are in the South – in North Carolina and South Carolina and, to a lesser extent, Georgia and Alabama. The Midwest and Northeast have the most problems with segregated metro areas.
More than 50 years after Congress passed the Fair Housing Act in 1968 racial segregation still persists across America, with no end in sight.
A detailed, interactive version of the map below can be found here.
Recent Posts:
 Survey of largest Michigan companies’ 2019 outlook…
- Lame duck Legislature looks the other way: Michigan…
- Michigan at the forefront of 50 states’ top issues in 2019
- Michigan ranks in bottom 10 for people moving in
- High-tech approach reveals more bad news: Michigan…
- Spending on 2018 Michigan congressional races…


Just curious Chad, how racially diverse is Macomb Twp? Isn’t that where you reside? I welcome you to close that segregation gap you write about, sell your house in “whiteyville”, and move to a more segregated area. What’s that? Oh that’s right, do as you say not as you do. Centrist my a$$.
There have been efforts to rescue parts of Detroit. Can you give us any insights on what is being done to correct these inbalances.