
A frustrated, seething liberal author, Kevin Baker, recently wrote an essay for The New Republic in which he engaged in an elaborate political fantasy in which Blue States in the Trump era would withdraw from the federal system as much as possible to create their own separate American states.
Baker called it a “virtual secession,” or a “Bluexit,” a play on words relating to Britain’s Brexit – its withdrawal from the European Union.
Baker acknowledged that many liberal Democrats living in Red States would be left behind but his advice was blunt: “Pack your bags.”
Meanwhile, The Cook Report released an analysis of the 2016 election results (enhanced by Five Thirty Eight) that demonstrated the up-for-grabs purple areas of the nation have nearly disappeared since the 1990s.
Today, the political landscape consists of mostly blue cities, mostly red rural areas, and a real hodge-podge of partisan leanings in suburbia. America has become a blue and red stew that never mixes into a purple hue but instead remains separated – like oil and water.
Yet, the Electoral College map and even the maps demonstrating county-by-county voting patterns in 2016 offer a skewed view of the U.S. electorate.
Dig deeper and the partisan divisions in America are found all the way down to the voting precinct level. Local government decisions follow suit on issues ranging from zoning restrictions to minimum wage ordinances, sometimes in surprising ways. City Lab recently reported that Deep Red Texas has laws allowing for far more local control – meaning parochial interests – than the Deep Blue state of Connecticut.
The story remains the same all over the nation, and it now comes into focus due to new cartographic creations that use interactive technology to view the 2016 election results on a precinct-by-precinct basis.
This granular look at the voting process is also available in Michigan, where Democrats still struggle to come to terms with Donald Trump’s razor-thin win over Hillary Clinton, and Republicans are conversely delighted by the outcome, the first time the GOP has carried the state in 28 years.
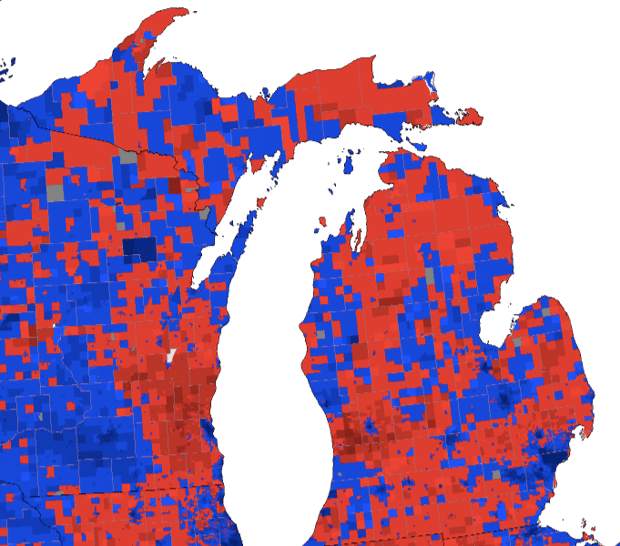
Mike Wilkinson of Bridge Magazine has created a precinct map of Michigan for the 2016 election results that clearly shows people live in “political bubbles” across the state. The latest assumptions are that all of Michigan north of Bay City is solid red and that all of the Rustbelt areas to the south are hardcore blue.
But the voting patterns from neighborhood to neighborhood are quite telling. Within a stretch of couple miles, the political views often are nearly polar opposites.
In Macomb County, which continues to receive national media attention as the ultimate example of a Midwest community that won Trump the presidency, the precinct results reveal a far more nuanced picture. Trump won by 40,000 votes in Macomb, which certainly played a leading role in his 10,000-vote margin statewide.
Curious national and international journalists for the past three decades have labeled Macomb as the homogenous, blue collar home of the “Reagan Democrats.” Yet, the working class southern area of the county is solidly Democratic while the white-collar north end is loyally Republican. The middle area is a mix.
The Bridge precinct map shows that bubbles of pro-Trump and pro-Clinton areas emerged in November in rather tight spaces.
In Eastpointe’s Precinct 12, located along the I-94 freeway, Clinton trounced Trump with 75 percent of the vote. In the adjacent neighborhood located diagonally to the northeast, Trump comfortably captured Precinct 10 in St. Clair Shores with 54 percent.
In Clinton Township’s Precinct 22, Clinton garnered a near-landslide with 62 percent support. Less than a mile down the Clinton River Spillway, in Precinct 7 of Harrison Township, the result was a 180-degree flip, with Trump establishing a commanding 64 percent showing.
Bridge points out that these unlikely divisions occur in many areas throughout the state. For example, Grand Rapids has become known as an island of blue in Kent County’s sea of red. Not so fast.
Here’s how Wilkinson explains the numbers and geography:
… A thin ribbon of Trump love appears in a neighborhood along East Fulton Street in Grand Rapids, an island in a sea of Hillary Clinton blue.
… Grand Traverse County backed Trump, giving him a 13-point victory over Clinton. But every precinct in the urban hub of Traverse City went for Clinton.
… Sometimes, the strongest support for two very different candidates sat side-by-side: In Saginaw County, the residents of Buena Vista Township, a majority African-American community, gave Clinton 81 percent of the vote. In the bordering township to the east, voters in almost-all-white Blumfield Township gave Trump 80 percent of their support.

We need to burst those Political Bubbles and let it all ooze out. Reconfigure the gerrymandered nonsense into bigger districts that make more sense